CHO-K1/NPY2/Gqi5 Stable Cell Line
| 询价 | |
| M00460 | |
|
|
|
|
|
|
|
|
|
| 询价 | |
| M00460 | |
|
|
|
|
|
|
|
|
|
Human Recombinant Neuropeptide Y Receptor Y2 Stable Cell Line
| Storage | Liquid nitrogen immediately upon delivery |
| Culture Medium | Ham’s F-12K (Kaighn’s), 10% FBS, 100 μg/ml Hygromycin B (Cat. #10687010, Invitrogen), 200 μg/ml Zeocin (Cat. #R250-01, Life Technologies) |
| Freeze Medium-DATA | 45% culture medium, 45% FBS (Cat. #10099-141, Gibco), 10% DMSO (Cat. #D2650, Sigma) |
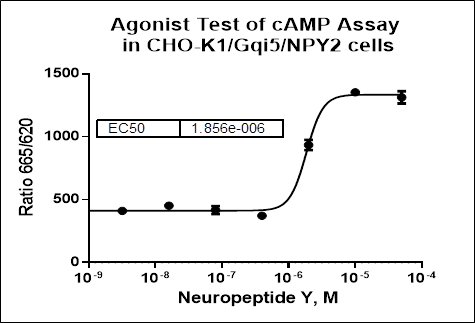
Figure 1. NPY-induced concentration-dependent stimulation of intracellular calcium mobilization in CHOK1/NPY2/Gqi5 cells. The cells were loaded with Calcium-4 prior to stimulation with a NPY2 receptor agonist, NPY. The intracellular calcium change was measured by FLIPR. The relative fluorescent units (RFU) were normalized and plotted against the log of the cumulative doses of NPY (Mean ± SD, n = 2). The EC50 of NPY on this cell was 5.5 nM.
Notes:
1. EC50 value is calculated with four parameter logistic equation:
Y=Bottom + (Top-Bottom)/(1+10^((LogEC50-X)*HillSlope))
X is the logarithm of concentration. Y is the response
Y is RFU and starts at Bottom and goes to Top with a sigmoid shape.
2. Signal to background Ratio (S/B) = Top/Bottom
»

»