Figure 1: FACS analysis of cell surface expression of ACE2 on CHO-K1 cells.
CHO-K1/ACE2 cells (green) and negative control CHO-K1 cells (blue) were stained with FITC conjugated SARS-CoV-2 Spike protein (RBD, His Tag) (Cat. No. Z03479, GenScript).

Figure 2: FACS analysis of cell surface expression of ACE2 on CHO-K1 cells from different passages.
The CHO-K1/ACE2 cells and the negative control CHO-K1 cells were stained with FITC conjugated SARS-CoV-2 Spike protein (RBD, His Tag) (Cat. No. Z03479, GenScript). P6, P11, P16 and P20 represent cell passage numbers.
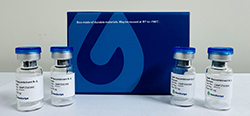
CHO-K1/ACE2 Stable Cell Line
| M00771 | |
|
|
|
| 询价 | |
|
|
|
|
|
|
| 联系我们 | |


